
100+ Resume Statistics for 2026
100+ resume and hiring statistics for 2026, each linked to its primary source: applications per job, ATS, AI in hiring, ghost jobs and myths to stop quoting.

Raman M.
Software Engineer & Founder of ResumeFast

On this page
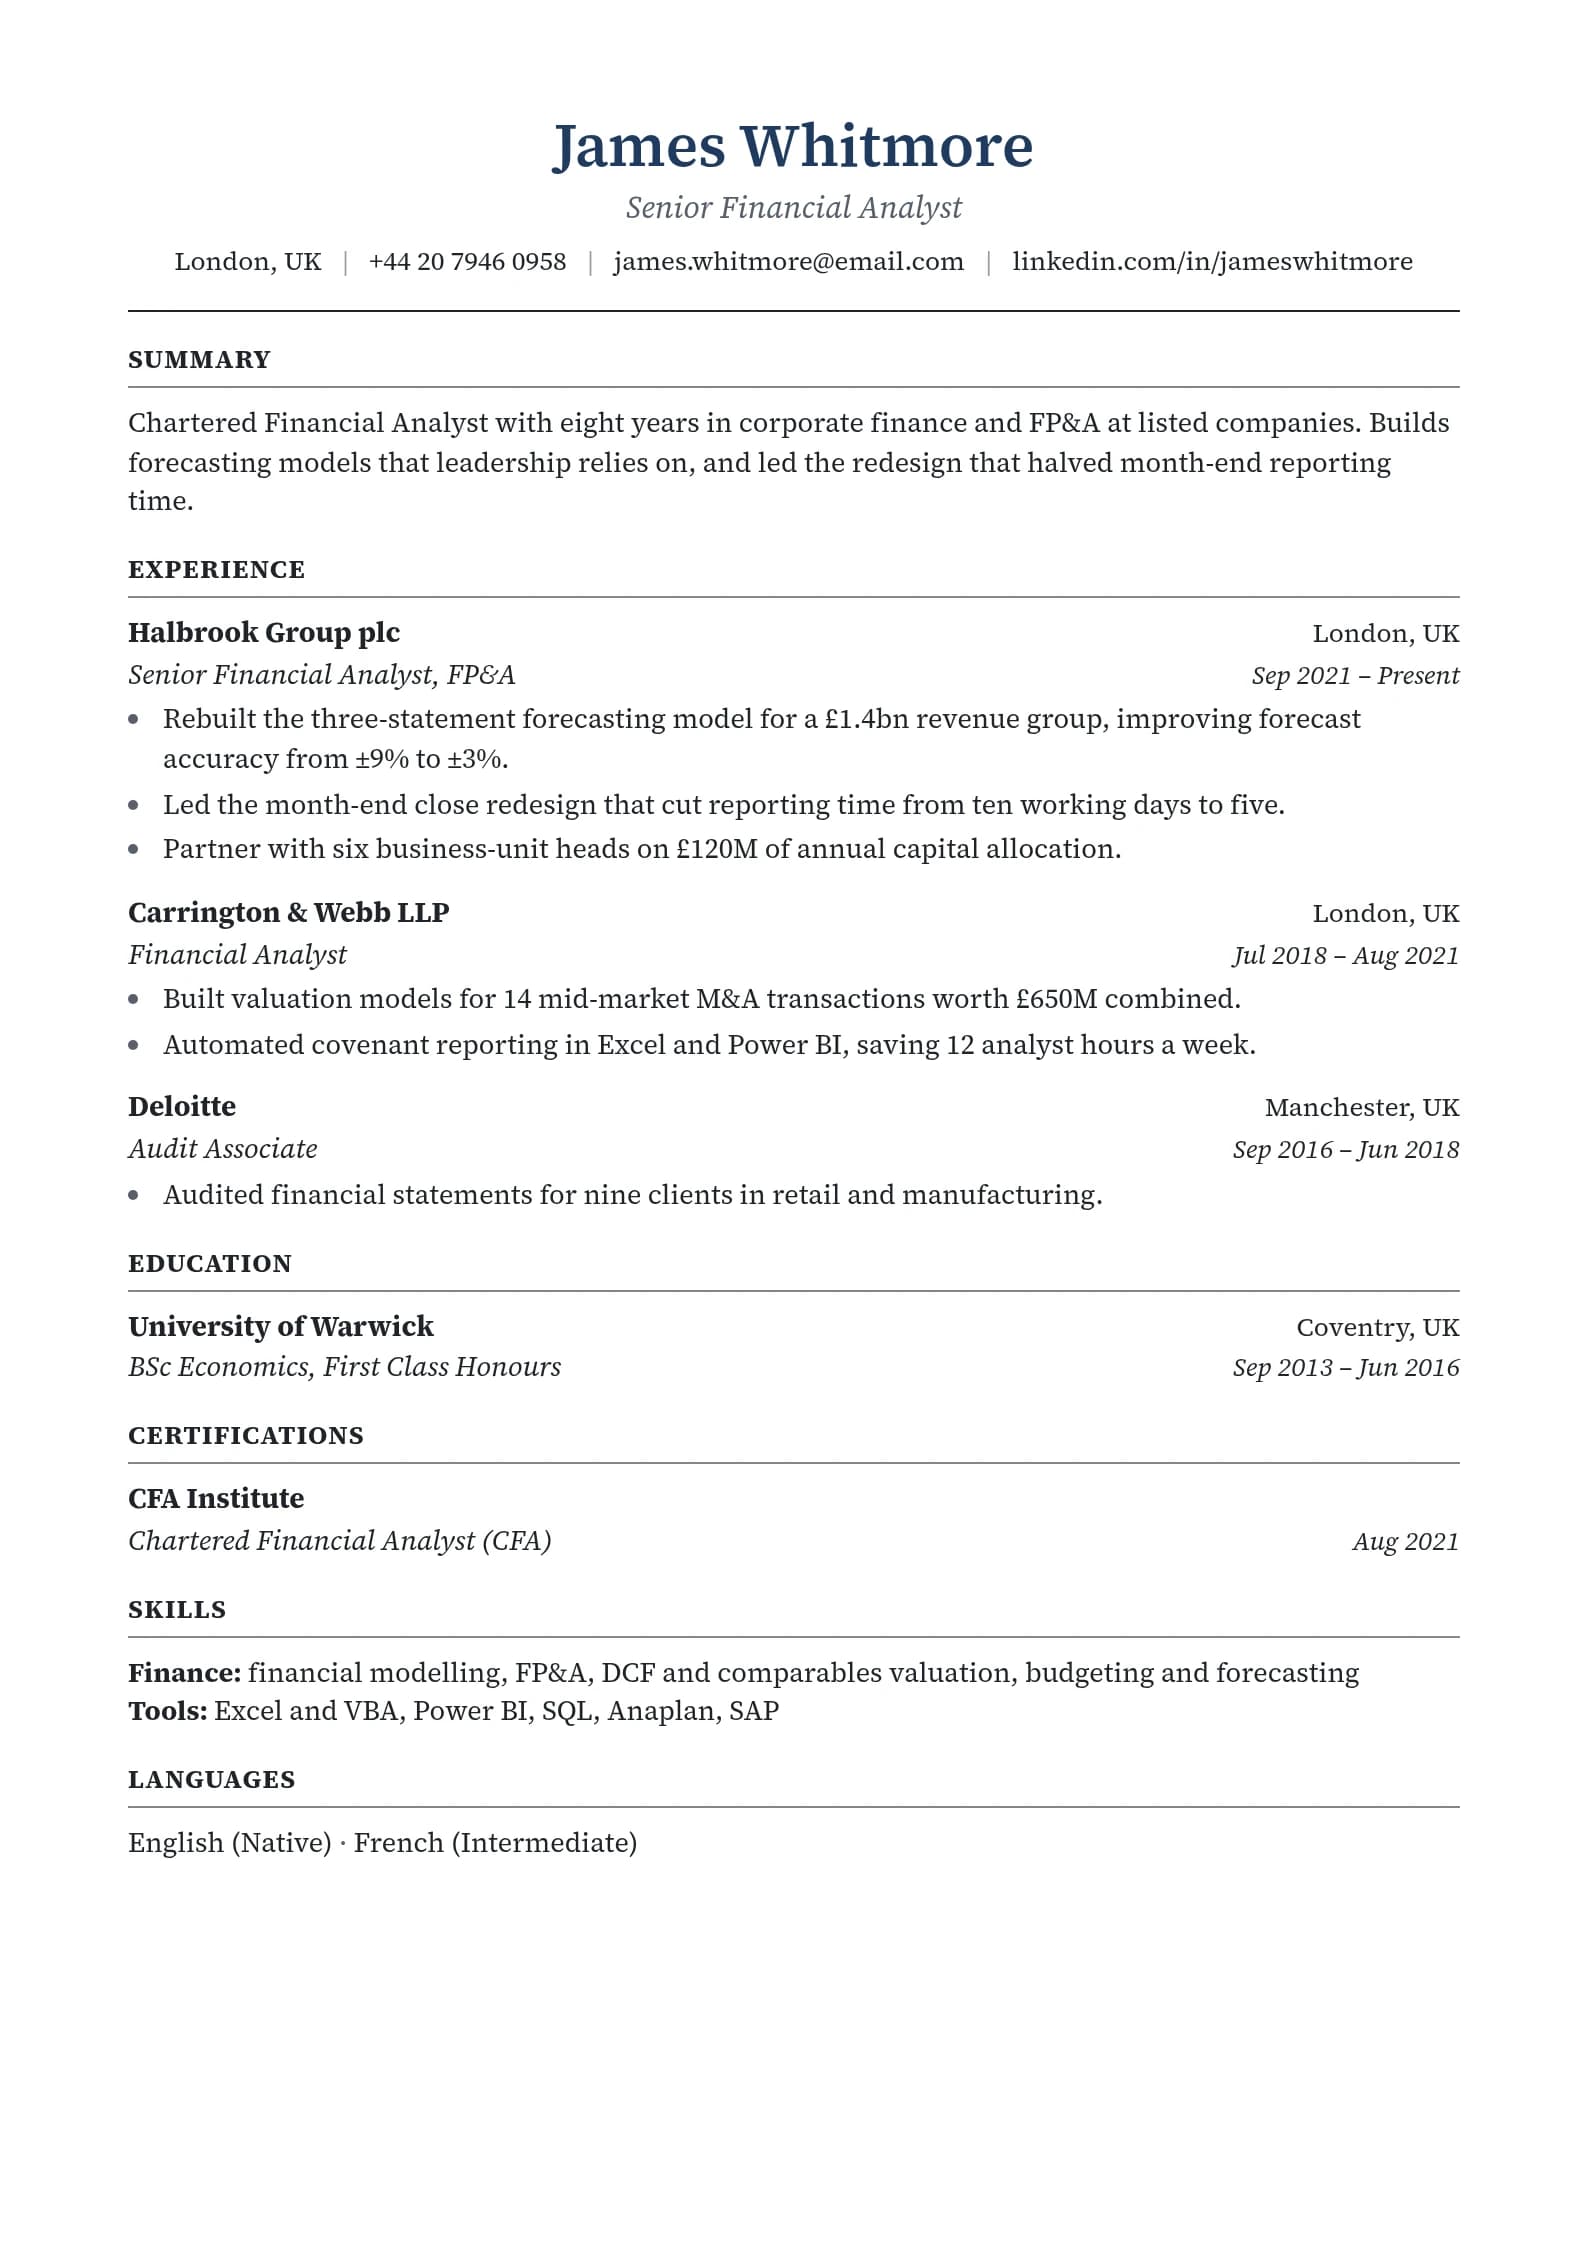
Build a resume that gets interviews
- ATS-optimized templates
- AI-powered writing
- Free to start
No credit card required
You sent the application. Maybe it was your fortieth this month. Now you're wondering how many other people applied, whether a human will ever read it, and whether that cover letter made any difference.
The short answer, from 2025 and 2026 data: the average job on Greenhouse drew 95 applications in 2025, up from 28 in 2021, and only 3.6% to 4.7% of applications now lead to an interview. 97.4% of Fortune 500 companies run an applicant tracking system (ATS), yet 23 of 25 recruiters interviewed in 2025 said their ATS does not auto-reject resumes for formatting or content. The competition is real; the robot gatekeeper is mostly a myth.
Every number on this page links to its original source, with the year and sample size where the source publishes them. In October 2026 we re-checked the whole page, corrected 27 figures, turned 6 popular claims into a myths section, and deleted 66 statistics we could not trace to any primary source. The update log at the end lists what changed.
Resume Statistics 2026 at a Glance
These are the numbers people ask about most. Each one is explained, with its caveats, further down.
| Question | Answer | Source |
|---|---|---|
| Applications per job | 95 in 2025, up from 28 in 2021 | Greenhouse customer data, 2025 |
| Applications per hire | 291, up from about 100 in early 2021 | Ashby, 2026 (109M applications) |
| Applications that lead to an interview | 3.6% to 4.7%, down from 7% to 8% in 2021 | Ashby, 2026 |
| Fortune 500 companies with a detectable ATS | 97.4% | Jobscan, 2026 (manual count) |
| Recruiters whose ATS does not auto-reject on formatting or content | 23 of 25 (92%) | Enhancv, 2025 (interviews) |
| Initial resume skim in an eye-tracking study | 7.4 seconds | TheLadders, 2018 |
| Hiring managers who call typos an instant deal breaker | 77% | CareerBuilder/Harris Poll, 2018 |
| U.S. job seekers who use AI | 74% | Greenhouse, 2025 (1,200 U.S. job seekers) |
| Jobs on Greenhouse classified as ghost jobs | 18% to 22% per quarter | Greenhouse, 2024 |
| Median length of unemployment | 11.4 weeks in August 2026, up from 9.9 | BLS, 2026 |
Applications Per Job: How Crowded the Funnel Is in 2026
The biggest change since 2021 is volume: each opening now receives far more applications, so each individual application converts less often.
-
The average job on Greenhouse drew 95 applications in 2025, up from 28 in 2021, a 239% increase in Greenhouse customer data pulled in August 2025. The same data shows recruiters now manage about one-third fewer roles than in 2021.
-
Each hire took 291 applications on average, compared with roughly 100 in early 2021, according to Ashby's 2026 Recruiter Productivity report, which covers 109 million applications and 247,000 jobs from January 2021 to March 2026. Ashby's customers skew toward tech companies and startups.
-
Applications per hire tripled from 2021 to 2024 and stayed above 300 throughout 2025 in the same Ashby dataset.
-
Only 3.6% to 4.7% of applications now lead to an interview, depending on role type (source), down from about 7% to 8% in 2021. In Ashby's words, candidates are "roughly 50% less likely to receive an interview today than they were five years ago."
-
Small businesses received an average of 180 applicants for every hire in 2024, per CareerPlug's 2025 Recruiting Metrics Report, which analyzed more than 10 million applications to over 60,000 small businesses.
-
About 8,200 job applications are submitted on LinkedIn every minute, according to LinkedIn's own company statistics page (2026).
-
On Handshake, applications per job rose 30% in a year while job postings fell 15%, squeezing the entry-level market for the class of 2025 (Handshake, 2025).
-
About 38% of job seekers who landed an offer did so within their first 30 applications, while 18% needed more than 100, in Huntr's 2025 Annual Job Search Trends Report, built from 1.78 million job entries logged by over 57,000 Huntr users. These are self-selected job-tracker users, so treat the split as a range, not a rule.
-
Huntr users' median time to a first offer stretched from 57 days in Q1 2025 to 83 days in Q4 2025, in the same report.
-
The famous "250 applicants per job" comes from a 2015 Glassdoor blog post, which said "each corporate job opening attracts 250 résumés," that four to six get interviewed and one gets an offer (Glassdoor, 2015, archived copy). It gives no data source or method. Plug your own numbers into the hiring funnel calculator or see the sourced Gem funnel rates in how long a job search takes.
The 2026 Job Market in Government Data
These come from the U.S. Bureau of Labor Statistics (BLS) and the Federal Reserve, using the latest releases available on October 1, 2026.
-
U.S. employers had 7.1 million job openings and made 5.2 million hires in August 2026 (BLS Job Openings and Labor Turnover Survey, released September 29, 2026).
-
The hires rate was 3.3% and the quits rate 1.9% in August 2026, in the same release. Few people are leaving jobs on their own, so fewer seats open up behind them.
-
There were about 0.7 hires for every job opening, better than the 2022 low of 0.5 but short of roughly 0.8 in August 2019, according to Indeed Hiring Lab's analysis of the August 2026 JOLTS data.
-
The median spell of unemployment was 11.4 weeks in August 2026, up from 9.9 weeks a year earlier (BLS Employment Situation, Table A-12, seasonally adjusted).
-
The average spell of unemployment was 26.3 weeks, up from 24.5 weeks (source) over the same year.
-
27.0% of unemployed people had been looking for 27 weeks or more in August 2026 (source), up from 25.6% in August 2025. If your search feels longer than it used to, the data agrees. Our job search length guide covers what to change.
-
Americans' expected chance of getting at least one job offer in the next four months fell to 18.0% in July 2026, the lowest reading since March 2021 (Federal Reserve Bank of New York, Survey of Consumer Expectations).
-
The U.S. economy is projected to add 5.9 million jobs from 2025 to 2035 (BLS Employment Projections, August 27, 2026). Earlier versions of this page quoted the older 2023 to 2033 projection.
-
Healthcare and social assistance is projected to add over 2.2 million jobs, about 37% of all new jobs through 2035 (source), more than any other sector, in the same BLS release. See which industries are hiring in 2026.
How Long Recruiters Look at a Resume (and What They Look At)
-
Recruiters spent an average of 7.4 seconds on an initial resume screen in TheLadders' 2018 eye-tracking study. The number comes from a timed first stage in which recruiters "were not aware they were being timed." The report does not say how many recruiters took part, and it is a company report, not peer-reviewed research. See our breakdown of the 7-second scan.
-
The widely quoted "6 seconds" is the 2012 version of the same study, in which 30 professional recruiters were observed over a 10-week period (TheLadders, 2012).
-
In 2012, recruiters spent almost 80% of their review time on six data points (source): name, current title and company, previous title and company, start and end dates for both roles, and education (same study).
-
In 2018, recruiters "spent more time focusing on job titles than on any other element," (source) scanning the left side of the page for titles and subheads. Clear, conventional job titles do a lot of work.
-
The "F-pattern" comes from web pages, not resumes. Nielsen Norman Group's 2006 study recorded how 232 users looked at thousands of web pages (NN/g, 2006). TheLadders' 2018 report only recommends resume layouts that suit F- and E-pattern scanning; it did not measure them.
-
39% of hiring managers said they spend less than a minute on a resume, and 23% less than 30 seconds, in a CareerBuilder survey conducted by The Harris Poll of 1,138 hiring and HR managers (June to July 2018).
-
"It takes just 30 seconds for most" HR professionals to decide whether a resume deserves a closer look, according to a 2025 Jobseeker survey of 1,013 HR professionals in 59 countries. That is self-reported, but it agrees with the eye-tracking work: the first pass is a skim measured in seconds, and it decides whether you get a real read.
What Gets a Resume Rejected
The most-cited source here is still CareerBuilder's 2018 survey of 1,138 hiring and HR managers, which asked which mistakes are an "instant deal breaker" (CareerBuilder/Harris Poll, 2018). It is eight years old, but no newer survey with a disclosed method has replaced it.
| # | Instant deal breaker | Share of hiring managers |
|---|---|---|
| 27 | Typos or bad grammar | 77% |
| 28 | Unprofessional email address | 35% |
| 29 | Resume without quantifiable results | 34% |
| 30 | Long paragraphs of text | 25% |
| 31 | Generic, not customized to the company | 18% |
| 32 | More than two pages | 17% |
| 33 | No cover letter | 10% |
Typos top the list by a wide margin, which is why proofreading beats almost any formatting tweak. See what the data says about resume typos, and run your bullets through the bullet point grader to catch the "no quantifiable results" problem.
What Gets a Resume Noticed
A 2016 CareerBuilder survey of 2,153 hiring and HR managers asked the opposite question: what makes HR managers more likely to pay attention to an application (CareerBuilder/Harris Poll, 2016).
| # | What gets attention | Share of HR managers |
|---|---|---|
| 34 | Resume customized to their open position | 63% |
| 35 | Skill sets listed first on the resume | 41% |
| 36 | A cover letter included with the resume | 40% |
| 37 | Application addressed to the specific hiring manager | 22% |
| 38 | Link to a blog, portfolio or website | 16% |
Newer behavioral data points the same way: match the job.
-
Candidates whose resume job title matched the title in the job listing had a 10.6 times higher interview rate in Jobscan's State of the Job Search 2025, which drew on anonymous activity in Jobscan's tools. This is a correlation: people whose titles match are often simply closer fits for the role.
-
Applications sent with a tailored resume had a 5.71% recorded interview rate, against 3.09% without one (1.85 times higher), in Huntr's Q2 2026 Job Search Trends Report. Here is how to tailor a resume without rewriting it.
-
Resume summaries that included a dollar figure had a 7.24% recorded interview rate, against 4.13% for summaries with no numbers at all (source), in the same Huntr report.
-
Recruiters preferred two-page resumes 2.3 times as often as one-page resumes in a 2018 ResumeGo hiring simulation in which 482 hiring professionals screened 7,712 resumes. Even for entry-level roles, the preference for two pages was 1.4 times. This replaces a "73% of recruiters prefer one page" claim we could not trace. More in the one-page resume myth.
-
Nearly 90% of employers look for evidence of problem-solving ability on graduates' resumes, and nearly 80% for teamwork, in NACE's Job Outlook 2025 survey of 237 employers (August to September 2024).
If you want to see how closely your resume's titles and keywords match a specific posting before you apply, paste both into our free keyword matcher. It needs no sign-up.
ATS Statistics: What Applicant Tracking Systems Really Do
An applicant tracking system (ATS) is software that collects, stores and organizes job applications so recruiters can search, sort and review them. Most large employers use one. Far fewer use it to reject people automatically.
-
Jobscan detected an ATS at 97.4% of Fortune 500 companies in 2026 (487 of 500), in its 2026 ATS Usage Report. This is Jobscan's own manual check of company career sites, not an industry census. Its yearly figure has ranged from 97.4% to 98.8% since 2018; the "99% of the Fortune 500" line still quoted everywhere is the 2019 figure, rounded.
-
Over 40% of Fortune 500 companies use Workday for hiring, and SuccessFactors is used by 12%, in the same report.
-
Across more than 13,000 companies in Jobscan's broader dataset, Greenhouse led with 19.0%, followed by Workday (17.5%), Lever (15.6%) and iCIMS (14.4%). (source) The mix looks very different from the Fortune 500, so no single parsing quirk applies everywhere. How ATS systems actually work.
-
23 of 25 U.S. recruiters (92%) interviewed by Enhancv said their systems do not auto-reject resumes for formatting, content or design (Enhancv, interviews in September and October 2025). Twenty-five interviews is a small, qualitative sample, but it is a real one with a stated method.
-
44% of those recruiters said their ATS includes an AI or "fit" score, in the same study. A score ranks applicants; it is not the same thing as an automatic rejection.
-
21% of companies said they automatically reject candidates at all stages of hiring without human review, in a 2024 Resume Builder survey of 948 business leaders. Automatic rejection exists; it just isn't the universal filter the internet describes.
-
64% of HR professionals said their organization's automation or AI tools automatically filter out unqualified applicants, in SHRM's 2022 Automation and AI in HR survey of 1,688 members.
-
Nearly 1 in 4 organizations used automation or AI to support HR activities at all (source) in that 2022 SHRM survey, so the 64% describes a minority of employers.
-
Jobscan says its tests show most ATS read and parse PDF resumes more accurately, and recommends PDF unless the posting asks for a .docx file (Jobscan, 2025). Jobscan does not publish the test method. See PDF vs Word for ATS.
-
76.8% of HR professionals want resumes submitted as PDFs, and only 12% prefer Word files, in the 2025 Jobseeker survey of 1,013 HR professionals.
-
"Many ATS parsers ignore" headers, footers and text boxes, according to Jobscan (Jobscan, April 2026), and two-column layouts are often read straight across both columns. Treat this as expert advice, not a measured failure rate: earlier versions of this page quoted "30% more accurate parsing" and "errors in 43% of ATS," and neither figure has a source. Practical fixes are in headers and footers and columns and tables.
The myth that started all of this, "75% of resumes are rejected by ATS," gets its own entry in the myths section below, and a full article in the 75% ATS rejection myth.
AI in Resumes and Hiring: 2025 and 2026 Data
Both sides of the desk now use AI, and neither trusts the other's use of it.
-
74% of U.S. job seekers personally use AI, according to Greenhouse's 2025 AI in Hiring Report, which surveyed 4,136 people in the U.S., U.K., Ireland and Germany, including 1,200 U.S. job seekers and 665 U.S. recruiters and hiring managers (November 2025).
-
41% of those U.S. job seekers admitted using prompt injections (source), hidden text designed to get past AI filters.
-
Only 8% of candidates believe AI makes hiring more fair, in the same report.
-
70% of hiring managers say AI helps them make faster and better hiring decisions (source) with fewer recruiter resources.
-
91% of recruiters have spotted candidate deception, in the same Greenhouse survey.
-
42.6% of Americans used AI tools the last time they updated their resume, and 7.5% let AI write most or all of it, in Novoresume's Resume Report 2026, a May 2026 survey of 2,000 U.S. adults aged 18 to 64.
-
People who let AI write most or all of their resume were three times as likely to admit lying on it (74.8% vs 24.6%) as people who used no AI, in the same survey.
-
80% of U.S. hiring managers say they can often tell when a resume has been written by AI, in Resume Genius's 2026 Hiring Insights Report, a Pollfish survey of 1,000 U.S. hiring managers. How hiring managers spot AI-written resumes.
-
79% of those hiring managers say candidates should disclose AI assistance (source) in application materials.
-
19% use AI to purposefully screen out applications before they get a human review, in the same report.
-
63% of U.S. job seekers have now been interviewed by an AI, up 13 percentage points in six months, according to a Greenhouse survey released May 1, 2026 (1,200 U.S. candidates, part of 2,950 across five countries).
-
70% of those candidates were never clearly told upfront that AI would be evaluating them. (source) Read how to pass an AI job interview before your next one.
-
39% of organizations use AI in their HR functions, in SHRM's State of AI in HR 2026 research of 1,908 HR professionals (April 2026).
-
27% of organizations apply AI in talent acquisition, more than in any other HR function, in the same SHRM research.
-
37% of organizations are "actively integrating" or "experimenting" with generative AI in recruiting, up from 27% a year earlier, in LinkedIn's Future of Recruiting 2025, a September 2024 survey of 1,271 recruiting professionals in 23 countries.
-
Recruiting teams using generative AI save about 20% of their work week, roughly a full day, according to the same LinkedIn report.
-
51% of companies were using AI in hiring in October 2024, and 68% expected to by the end of 2025, in the Resume Builder survey of 948 business leaders. The 68% is a forecast, not a measurement.
-
Gartner projects that by 2028, one in four candidate profiles worldwide will be fake, in its April 2025 research note "Mitigate Rising Candidate Fraud Through Identity Verification" (as published by Greenhouse). This is a prediction, not a survey result, but it explains why employers are adding identity checks.
We removed six AI figures that were in the earlier version of this page, including "78% of job seekers use AI for their resume" and "24% of companies reject AI content," because none appeared in the survey it was credited to. The old "74% of hiring managers can spot AI" figure traced to a 2024 CV Genius survey that doesn't publish its sample size, so the Resume Genius 2026 figure above replaces it.
Ghost Job Statistics
A ghost job is a job posting for a role the employer has no real, immediate plan to fill. They are hard to measure, so read every number here as an estimate. Our ghost jobs hub covers the full data and how to spot one, and how to spot a fake job posting covers outright scams.
-
"There are no official statistics on the magnitude of ghost jobs," the Congressional Research Service wrote in April 2025. Every figure below comes from a company's own platform data or survey.
-
18% to 22% of jobs posted on the Greenhouse platform in any given quarter are classified as ghost jobs (Greenhouse 2024 State of Job Hunting Report, December 2024). Greenhouse does not publish how it classifies them.
-
Three in five candidates suspect they have encountered a ghost job, in the same report's survey of 2,500 workers in the U.S., U.K. and Germany.
-
69% of U.S. job seekers say they have encountered fake job postings, in Greenhouse's 2025 AI in Hiring Report.
-
67% of job seekers have suspected a posting of being fake or misleading, in Resume Genius's 2026 Job Seeker Insights Report, a March 2026 survey of 1,000 active U.S. job seekers.
-
55% of those job seekers say their top frustration is being ghosted after applying. (source)
-
40% of hiring managers said their company posted a fake job listing in 2024, and 3 in 10 said their company had one live at the time, in a Resume Builder survey (May 2024; 649 of 1,641 hiring managers completed the full survey).
-
On the other side: 82% of jobs opened in Ashby's system in 2024 led to a real hire, and only 3.5% closed with no reason given (Ashby, April 2025, over 22,000 jobs from 2021 to 2024). How common ghost jobs are depends heavily on the employer and the platform.
-
Since January 1, 2026, Ontario requires employers with 25 or more employees to state in public job postings whether a vacancy actually exists, and to tell interviewed applicants about the hiring decision within 45 days of their last interview (Government of Ontario, Employment Standards Act guide).
Cover Letter Statistics
-
Tailored cover letters drew a 53% higher callback rate than applications with no cover letter at all, in a ResumeGo field experiment that sent 7,287 applications between July 2019 and January 2020. The 53% is for tailored letters specifically, so it is not evidence that attaching any letter works.
-
87% of hiring professionals said they do read cover letters (source), in ResumeGo's companion survey of 236 recruiters and hiring managers (same report).
Two CareerBuilder figures above also apply: 40% of HR managers pay more attention when a cover letter is included (2016), and 10% of hiring managers call a missing cover letter an instant deal breaker (2018). The cover letter guide shows how to write one that is actually tailored.
LinkedIn, Referrals and Networking Statistics
-
87% of recruiters said LinkedIn was the most effective channel for vetting candidates, in Jobvite's 2016 Recruiter Nation survey of 1,600 recruiting and HR professionals. It is an old figure, but it is where the "87% of recruiters use LinkedIn" line comes from.
-
77% of recruiters used LinkedIn for recruiting, more than any other channel, in Jobvite's 2018 survey of 805 U.S. recruiters. How your LinkedIn and resume should differ.
-
Members with a profile photo get up to 2x more profile views, according to LinkedIn Help. The "14x" and "21x" photo figures still repeated online no longer appear on any LinkedIn page we could find.
-
52% of referred candidates passed the initial screen, compared with 35% of candidates overall, in Ashby's 2026 Recruiting Operations Benchmarks, based on over 54 million applications. A referral still gets you a better first look.
-
Inbound applicants made up 52% of all hires in Q1 2026, up from 38% in early 2021, in Ashby's 2026 Recruiter Productivity data. Applying through the front door works more often than the "hidden job market" claims suggest (see the myths below).
-
51% of hirers say they are more likely to contact a candidate who gives context about a career break (LinkedIn, March 2022).
-
64% of women have taken a career break at some point, according to the same LinkedIn announcement. How to return to work after a career break.
Remote and Hybrid Work Statistics
-
Among U.S. employees whose jobs can be done remotely, 52% work hybrid, 26% work fully remote and 22% work on-site (Gallup, May 2026). Gallup measures employees, not companies.
-
Remote-only applications had a 3.53% recorded interview rate, 42% below hybrid-only roles at 6.07%, in Huntr's Q2 2026 report. Fully remote roles attract a national applicant pool, so expect more competition.
Careers, Tenure and Demographic Statistics
-
The median worker had been with their current employer 4.1 years in January 2026, up from 3.9 years in January 2024 (BLS Employee Tenure, September 24, 2026).
-
Workers aged 25 to 34 had a median tenure of 3.0 years, compared with 9.6 years for ages 55 to 64, in the same release. Short stints early in a career are normal.
-
People born in the late baby boom (1957 to 1964) held an average of 12.9 jobs from age 18 to 58 (BLS National Longitudinal Survey of Youth 1979). BLS counts a job as a period with one employer, so this is not the number of career changes. Career change resume guide.
-
64% of workers aged 50 and over have seen or experienced age discrimination at work, a share unchanged from 2024 to 2025 (AARP, surveys of 901 and 1,656 people). Resume tips for candidates over 50.
-
Women are 16% less likely than men to apply to a job after viewing it, in LinkedIn's Gender Insights Report (2019), based on activity by more than 610 million members.
-
Women apply to 20% fewer jobs than men, in the same LinkedIn report.
-
Women are 16% more likely than men to be hired after they apply. (source) Applying is the step that leaks; once women apply, they do better.
-
The unemployment rate for veterans was 3.5% in 2025, lower than 4.2% for nonveterans (BLS Employment Situation of Veterans, April 2026). An older claim that veterans face "31% higher unemployment in their first year" has no BLS source. Military to civilian resume guide.
Skills, Degrees and Credentials Statistics
-
Controlling for the mix of occupations, the share of job postings requiring a college degree fell only 3.6% from 2014 to 2023, according to the Burning Glass Institute and Harvard Business School (February 2024), using Lightcast data on 316 million job postings.
-
About 45% of firms that removed degree requirements changed them "in name only," with no meaningful difference in who they hired, in the same study.
-
Removing a degree requirement raised non-degree hiring by about 3.5 percentage points on average, which added up to about 97,000 extra non-degree hires a year out of 77 million (source), or "not even 1 in 700 hires." Dropping the requirement is not the same as dropping the preference. Is a college degree still worth it?
-
A skills-based approach could expand talent pools 6.1x globally and 15.9x in the U.S., according to LinkedIn Economic Graph research (March 2025). That is a model of what could happen, not a measure of current hiring. When a skills-based resume works best.
-
LinkedIn's fastest-growing U.S. skills for 2026 are led by AI skills such as prompt engineering, retrieval-augmented generation (RAG) and LangChain, alongside human skills like public speaking and cross-functional coordination (LinkedIn Skills on the Rise 2026, growth measured from December 2024 to November 2025).
-
IBM estimates the half-life of a learned skill at about five years, and shorter for technical skills (IBM Institute for Business Value, "The enterprise guide to closing the skills gap," 2019). The "2.5 years" figure often attached to IBM does not appear in that research.
Job Search Timing and Effort Statistics
-
Applying within the first four days of a posting gave applicants a 64.7% average boost over the competition, in TalentWorks' 2018 analysis. Its earlier study of 1,600 applications found applying within 96 hours could make you "up to 8x more likely to get an interview" for a single job (TalentWorks, 2017). Both are correlational, and TalentWorks has since shut down.
-
Applying on a Monday was linked to a 46% higher chance of an interview callback in the same 2018 TalentWorks analysis. This replaces a "2.5x more likely Monday to Wednesday" claim that appears nowhere in TalentWorks' work.
-
Job seekers who sent 11 to 20 applications in a quarter had an 8.12% interview rate per application, against 2.86% for those who sent 100 or more, in Huntr's Q2 2026 report (1,925 users, 90,924 applications). Huntr notes this does not prove that sending fewer applications causes more interviews. Why fewer, better applications win.
-
The median time to hire was 30 days for business roles and 40 days for technical roles in Ashby's 2026 data.
-
Unemployed Americans spent about 41 minutes a day on job search on weekdays, in time-use research by Alan Krueger and Andreas Mueller (IZA, 2008). It is old, but it is a measured figure; the "11 hours a week" claim on many sites has no source.
Resume Statistics Myths to Stop Quoting
These numbers appear on hundreds of pages. Here is where each one came from and what the evidence actually shows.
| The claim | Where it came from | What the evidence says |
|---|---|---|
| "75% of resumes are rejected by ATS" | Preptel, a "job search services provider," quoted by Computerworld in 2012. No method was ever published. | 23 of 25 recruiters interviewed in 2025 said their ATS doesn't auto-reject for formatting or content (Enhancv). Some employers do auto-reject: 21% of companies in a 2024 Resume Builder survey said so. |
| "Recruiters spend 6 seconds on a resume" | TheLadders' 2012 study of 30 recruiters | The 2018 follow-up measured 7.4 seconds for the initial screen. It is the first skim, not the whole review. |
| "Every job gets 250 applicants" | A 2015 Glassdoor blog post with no stated source | 95 applications per job on Greenhouse in 2025; 180 applicants per hire at small businesses in 2024 (CareerPlug). It varies by platform and role. |
| "70% (or 85%) of jobs are never posted and are filled through networking" | Often credited to BLS or the Department of Labor, but no such data series exists. The 85% figure is from a 2016 LinkedIn post by Lou Adler summarizing an open online poll of about 3,000 self-selected respondents. | Referrals help (52% pass the first screen vs 35% overall), but inbound applicants made up 52% of hires in Q1 2026 (Ashby). |
| "Women apply only if they meet 100% of the requirements, men at 60%" | A 2014 Harvard Business Review article presents it as a statistic "you've probably heard." We could not find a published study with a sample behind it. | LinkedIn's behavioral data: women are 16% less likely to apply after viewing a job, and 16% more likely to be hired once they do. |
| "99% of the Fortune 500 use an ATS" | Jobscan's 2019 count (98.8%) | Jobscan's 2026 count is 97.4%. It is a manual check of large-company career sites and says nothing about smaller employers. |
Methodology and Update Log
How we chose sources. We only cite primary sources: government agencies (BLS, the New York Fed, the Congressional Research Service, the Government of Ontario), the original survey publisher's own report or press release, and applicant tracking system vendors' published data. Where a source has gone offline (TalentWorks, the original Glassdoor and TheLadders pages), we link to an archived copy of the original. Many hiring surveys come from companies that sell resume or recruiting products, including resume builders like ours; we name the publisher on every figure so you can weigh that yourself.
How we checked them. Every figure on this page links to the page or PDF where it appears, and we opened each one in October 2026 to confirm the number, the year and the sample. Where a source does not publish its sample size or method, we say so. If we could not find a number in its claimed source, we removed it rather than leave an unsourced statistic on a page people cite.
Update log
- Updated October 1, 2026: re-verified every figure against its primary source; deleted 66 statistics we could not trace, corrected 27 (including Fortune 500 ATS use from 99% to 97.4%, BLS job projections to 2025 to 2035, median tenure and AARP's age-discrimination figure), reframed 6 popular claims as myths with their origins, and added 2025 and 2026 data on application volume, AI in hiring, ghost jobs and the current U.S. labor market.
- February 17, 2026: first published.
Cite this page: ResumeFast, Resume Statistics 2026, updated October 2026, https://resumefast.io/blog/resume-statistics-2026
Putting the Numbers to Work
The data points to a few habits that consistently matter: match your job titles and keywords to the posting, quantify your results, proofread until there are no typos, tailor anything you send (cover letters included), and apply early. None of that requires beating a robot. It requires making a fast human skim easy.
You can build your resume and cover letters for free in the ResumeFast resume builder, starting from an ATS-friendly template, with no credit card. Your first PDF or Word download is free; after that, PDF and Word need Pro at $6.95 a month. You can also check your resume against a real posting with the ATS checker (one check a month on a free account).
Frequently Asked Questions
How many applications does the average job get in 2026?
It depends on the platform. Greenhouse data shows the average job drew 95 applications in 2025, up from 28 in 2021, and Ashby data shows 291 applications per hire. The often quoted 250 applicants per job comes from a 2015 Glassdoor blog post with no stated source.
How long do recruiters spend looking at a resume?
TheLadders measured an average initial screen of 7.4 seconds in 2018, up from 6 seconds in its 2012 study of 30 recruiters. In a 2025 Jobseeker survey of 1,013 HR professionals, most said it takes just 30 seconds to decide whether a resume deserves a closer look. That first skim decides whether you get a full read.
Do ATS systems really reject 75% of resumes?
No. The 75% figure was attributed to Preptel, a job search services company, in a 2012 Computerworld article, with no published method. In 2025, 23 of 25 recruiters interviewed by Enhancv said their ATS does not auto-reject resumes for formatting or content, though 21% of companies in a 2024 Resume Builder survey said they reject some candidates without human review.
What percentage of companies use an applicant tracking system?
Jobscan detected an ATS at 97.4% of Fortune 500 companies in 2026, based on a manual check of their career sites. No reliable census exists for all employers. Across more than 13,000 companies in Jobscan's wider dataset, Greenhouse, Workday, Lever and iCIMS are the most common systems.
How many job seekers use AI to write their resume?
74% of U.S. job seekers personally use AI, according to Greenhouse's 2025 AI in Hiring Report, and a May 2026 Novoresume survey found 42.6% of Americans used AI the last time they updated their resume. 80% of U.S. hiring managers say they can often tell when a resume was written by AI, so edit AI drafts into your own words and facts.
How common are ghost jobs?
There are no official statistics, according to the Congressional Research Service. Greenhouse classifies 18% to 22% of jobs posted on its platform each quarter as ghost jobs, while Ashby found 82% of jobs opened in its system in 2024 led to a real hire. The rate depends heavily on the employer and platform.
Are cover letters still worth writing in 2026?
Yes, if you tailor them. In a ResumeGo field experiment of 7,287 applications, tailored cover letters drew a 53% higher callback rate than no cover letter at all, and 87% of hiring professionals in ResumeGo's survey said they read cover letters.
Your resume is your first impression. Make it count.
Build an ATS-optimized resume that gets read, with AI help on every section.
No credit card required. Your first PDF or Word download is free; after that, Pro is $6.95 a month.
Continue Reading
View all articles
Seasonal Job Resume: How to Land a Holiday Job in 2026

Cover Letter vs Resume: Differences and When You Need Both

The Complete ATS Resume Guide (2026)

How to Write a Resume: Resume Writing Guide for 2026

Job Hopping on a Resume: How Short Tenures Read in 2026

New Grad Resume Guide: Get Hired Without Experience (2026)
Build a resume that gets interviews
Ready to build your resume?